The most common scaling mistake in indoor entertainment is copying a template from the wrong size class. A compact 500m2 venue that borrows the zone ratios of a 5,000m2 destination center spreads its few attractions across too much floor; industry benchmarking found small venues that copy large-center templates lose roughly 22% of playtime per customer to overcrowding and dead walking distance (FEC industry benchmark, planning reference). The same error in reverse - packing a 5,000m2 shell with a compact venue's short attraction list - leaves most of the floor earning nothing.
The planning process itself does not change with size. Every multi-attraction indoor entertainment venue is planned with the same five documents: feasibility study, business plan, space program, layout design, and budget. What changes with every size class is the ratio inside each document: how many attractions the mix carries, how much floor each zone receives, what the budget buys, and what revenue the model must produce. Size is a set of ratios, not a different discipline.
| Planning Document | What Size Changes | What Stays Fixed |
|---|---|---|
| Feasibility study | Catchment radius, competing supply, revenue ceiling | Method: demand, competition, revenue projection |
| Business plan | Capital scale, staffing count, payback period | Structure: costs, pricing, three-year projection |
| Space program | Attraction count, zone ratios, queue capacity | Method: area per element, then total against shell |
| Layout design | Zone count, circulation loop length | Method: zones on one circulation loop |
| Budget | Absolute capital, equipment tier | Structure: equipment, fit-out, power, first-year ops |
This guide walks the size range from 500m2 to 5,000m2 in three classes. For each class it gives the attraction-mix scale, the budget anchor, and the capacity math, so the ratios can be chosen deliberately instead of inherited from a template built for a different size. The planning documents themselves are covered step by step in our empty-space planning guide and our business plan guide.
Market research segments indoor entertainment facilities by floor area, and the segments line up with distinct business models. Published market segmentations split facilities at roughly 5,000, 10,000 and 20,000 square feet; industry design practice describes indoor FECs ranging from about 10,000 square feet (roughly 1,000m2) up to 200,000 square feet for the largest indoor facilities (planning references). For planning a multi-attraction indoor entertainment venue, three working classes cover the 500m2 to 5,000m2 range.
| Size Class | Floor Area | Business Model | Typical Mix |
|---|---|---|---|
| Compact | 500-1,000 m2 | Neighborhood venue, high visit frequency | 1 social anchor + 2-4 quick-play + small F&B |
| Mid-size | 1,000-2,500 m2 | Regional destination, party and group revenue | 2-3 anchors + 4-8 quick-play + full F&B + party rooms |
| Destination | 2,500-5,000 m2 | All-day destination, tourist and group draw | 3-5 anchors + themed zones + full F&B + retail + events |
The classes differ in what draws the customer. A compact venue wins on convenience and repeat visits; its revenue model is frequency. A mid-size venue wins on group occasions - birthdays, corporate events, school trips; its revenue model is bookings. A destination venue wins on dwell: guests travel to it and stay for half a day; its revenue model is per-visit spend across many streams. Choosing the class first is what keeps the attraction mix, the budget and the revenue model pointed at the same customer.
Published market segmentation puts many facilities in the 5,001-10,000 square foot band (roughly 465-930m2) with a variety of attractions such as go-karts, laser tag, mini golf and arcade games, and the large-center band at 10,001-20,000 square feet (930-1,860m2) and above (market segmentation, planning reference). The 500m2 to 5,000m2 range in this guide therefore spans from the compact end of the standard segmentation to well beyond the large-center band - the full span a multi-attraction operator realistically plans across.
The attraction mix scales with the floor, and the scaling rule is anchors first: each size class carries a certain number of anchor attractions - experiences worth a trip on their own - and fills the remaining floor with quick-play and interactive density around them. Space per attraction is a documented planning input; our guides on bowling lane counts for 1,000m2, attraction counts and mini golf space carry the per-attraction arithmetic.
| Element | Planning Space (Reference) | 500-1,000 m2 | 1,000-2,500 m2 | 2,500-5,000 m2 |
|---|---|---|---|---|
| Bowling (string or duckpin) | ~1,000 sq ft per 10-pin lane; string/duckpin less | 0-2 lanes | 2-6 lanes | 6-12 lanes |
| VR arena or simulator zone | ~45 m2 per simulator bay group | 0-1 zone | 1-2 zones | 2-4 zones |
| Interactive LED / quick-play | 50-200 m2 per zone | 1 zone | 2-3 zones | 4-6 zones |
| Darts / archery bays | ~80 cm per dart lane; ~6 m per archery bay | 0-2 bays | 2-6 bays | 6-12 bays |
| Mini golf | 300-600 m2 per course (course-dependent) | 0-1 course | 0-1 course | 1 course |
| Party rooms | 15-30 m2 per room | 0-1 room | 2-3 rooms | 4-6 rooms |
| F&B + kitchen | 10-15% of floor | Small counter | Full kitchen | Full kitchen + bar |
The table reads as a portfolio, not a checklist. At 500m2 the venue can afford exactly one anchor - usually a compact social attraction such as string bowling or duckpin - surrounded by quick-play density. At 1,000-2,500m2 the venue carries two or three anchors and the party machinery that makes group bookings the revenue engine. At 2,500-5,000m2 the venue is a collection of themed zones, each with its own anchor, and the planning question shifts from "what fits" to "what sequence keeps guests moving between zones". Our 1,000m2 attraction mix model works a mid-size example in full.
Two scaling rules hold across the range. First, anchor count grows slower than floor area: doubling the floor does not double the anchors, because each anchor needs its supporting quick-play and queue space to earn. Second, quick-play density is the shock absorber: it fills the gaps between anchor sessions, and it is the first place to add or cut when the space program does not balance.
Budget scales with floor area, but not linearly in equipment: the shell, fit-out, power and HVAC take a growing share as the venue grows, while equipment cost concentrates in the anchors. Published planning figures give the anchors: a 1,000-square-meter FEC is budgeted from roughly $450,000 in 2025-2026 planning guides; indoor play equipment is commonly planned at $300-$1,000 per square meter; small play cafes start under $500,000 while large multi-attraction centers exceed $5-10 million (published planning guides, planning references).
| Size Class | Total Capital (Planning Reference) | Equipment Share | Dominant Cost |
|---|---|---|---|
| Compact 500-1,000 m2 | ~$450K-$900K | High (60-70%) | Anchor equipment |
| Mid-size 1,000-2,500 m2 | ~$1M-$2.5M | Medium (50-60%) | Equipment + fit-out |
| Destination 2,500-5,000 m2 | ~$2.5M-$10M | Lower (40-50%) | Shell, fit-out, power, HVAC |
The equipment share falls as venues grow because the building itself becomes the cost: shell construction, power distribution, HVAC and fire systems scale with the envelope, not with the attraction count. This is why the feasibility study must precede the equipment list - a destination-class budget is mostly a building budget, and an operator who spends like a compact venue on a destination shell runs out of money before the anchors arrive. Our business plan guide carries the full budget structure.
Budget per square meter is the honest comparison metric across classes. Equipment at $300-$1,000 per square meter (planning reference) is the equipment line only; total project cost per square meter lands higher once shell, fit-out and first-year operations are included. Comparing total cost per square meter across your size class - not across classes - is what keeps the budget honest.
Capacity planning answers the question investors ask first: how many guests, at what spend, per year. Published market analysis puts the average FEC at roughly 150,000-200,000 visitors annually with family visits spending about $50-$75 per visit (market analysis, planning reference). Throughput planning converts those annual figures into an hourly capacity the floor must support at peak.
| Size Class | Peak Hourly Capacity (Planning) | Annual Visitors (Reference) | Staffing Posture |
|---|---|---|---|
| Compact 500-1,000 m2 | 40-80 guests | 30,000-80,000 | 2-4 staff cross-trained |
| Mid-size 1,000-2,500 m2 | 80-200 guests | 80,000-150,000 | 5-12 staff + party hosts |
| Destination 2,500-5,000 m2 | 200-450 guests | 150,000-250,000+ | 12-30 staff, zone leads |
Peak hourly capacity is set by the anchors, not the door. Each anchor has a sessions-per-hour figure and an average group size; the venue's hourly throughput is the sum over anchors, and quick-play density absorbs the queue overflow. The counting method is the one our attraction count guide walks through. A venue whose peak demand exceeds its anchor capacity does not lose the demand quietly - it turns it into queues, and queues burn dwell time: queue-area beverage points recover some of it (a measured ~22% per-capita lift in a theme-park setting, vendor case, planning reference), but the first fix is anchor capacity.
Dwell time is the capacity multiplier. Active-entertainment venues hold guests for roughly 2-3 hours against 30-60 minutes for passive formats, and venue analysis found roughly a 1.3% per-capita spend increase per 1% of additional dwell time (planning references). A size class that plans seating, F&B and programming for dwell converts its capacity into spend; a class that plans only for throughput converts it into queue time. Our dwell time guide covers the levers.
The revenue model is where size class, budget and capacity meet. The per-guest anchor is stable across the range: industry benchmarks put average spend at individual-location FECs around $25 per guest across admission, games, food, retail and rentals, with per-paying-guest ranges commonly $11-$24 (planning references). What changes across size classes is the revenue mix and the fixed-cost base the revenue must clear.
| Revenue Stream | Typical Share (Planning) | Compact | Destination |
|---|---|---|---|
| Admission / attraction tickets | ~40% | Dominant stream | One stream among many |
| Other attractions | ~19% | Quick-play add-ons | Themed zone tickets |
| Food and beverage | ~16% | Counter service | Full kitchen + bar, event catering |
| Parties and group events | grows with class | Occasional | Booked-out calendar, premium tiers |
| Retail and other | remainder | Minimal | Exit-path retail + merchandise |
Two structural levers move the model more than foot traffic does. Packaging raises per-guest spend without new equipment: bundles, family deals and tiered passes move guests across revenue streams - our attraction package blueprint gives the five-model menu. Space productivity sets the ceiling: revenue per square meter is the metric that makes different size classes comparable, and our VR arena revenue-per-square-meter analysis and maximization guide show how a single zone is pushed toward its ceiling.
The fixed-cost base is what makes size class a commitment. A destination venue's shell, power and staffing base must be cleared before the first dollar of margin; a compact venue clears its much smaller base on anchor weekends alone. This is why under-utilized destination-class floors are the most expensive mistake in the industry - the model must clear the base every month, not on average.
Most operators should enter the market one size class below their ambition. A compact first venue produces the operating data - per-guest spend, package attach rates, peak patterns - that de-risks the larger venue, and it produces it while earning rather than while burning investor capital. The discipline is to design the compact venue so it can grow: the growth path is planned at the layout stage, not improvised after opening.
The -22% playtime penalty for copying large-center templates into small venues (planning reference) has a mirror-image discipline: do not copy compact templates into larger shells either. Growth is a re-planning exercise with new ratios, and the five planning documents are re-run for the new size class - feasibility refresh, revised space program, re-zoned layout, scaled budget. Our empty-space planning guide is the checklist for that re-run, and our zoning guide carries the zone-ratio work.
Across the whole 500m2 to 5,000m2 range, the highest-return planning step is the same: test the layout in 3D before construction. A 3D layout test catches the size-class errors this guide describes - template copying, over-dense anchor zones, circulation that skips F&B - while they are still a drawing. At destination scale a layout test also validates queue capacity and party-room flow against the peak hourly capacity the model demands.
Professional venue planning treats audience, space, attraction mix, budget and revenue model as one system, and equipment is its output. Our empty-space planning guide, business plan guide and attraction count guide cover the process; a free 3D layout design is available at our 3D layout page, and the full offer - planning, equipment, installation and revenue model - is on our sportainment solutions page.
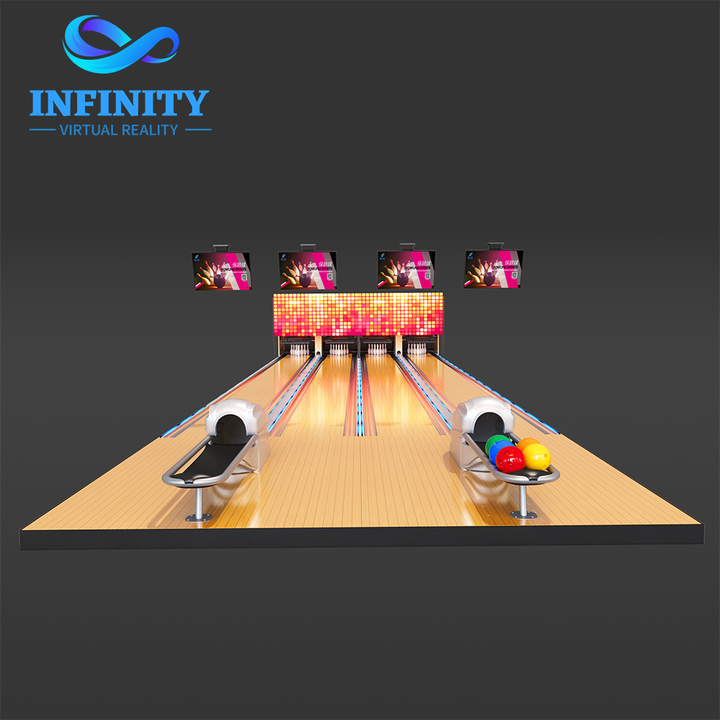
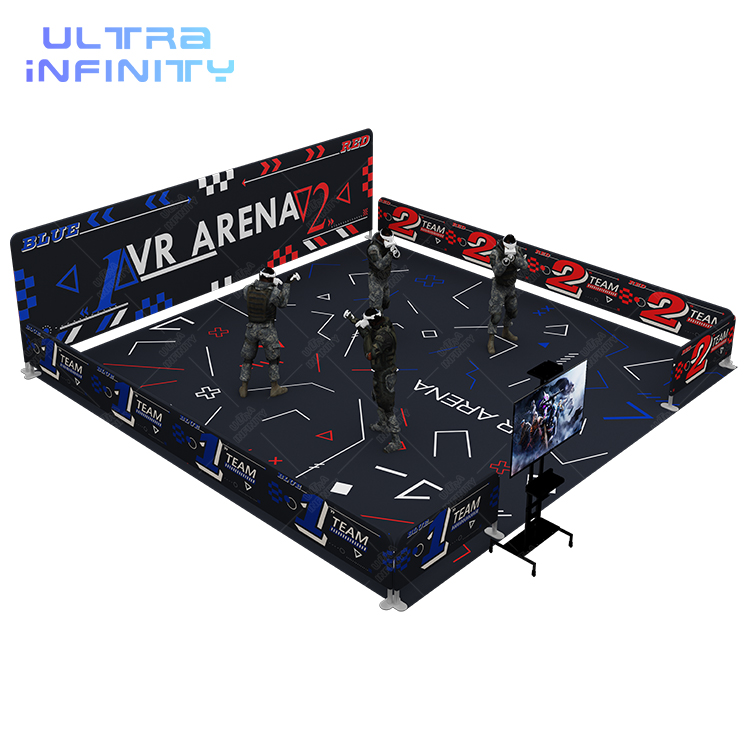
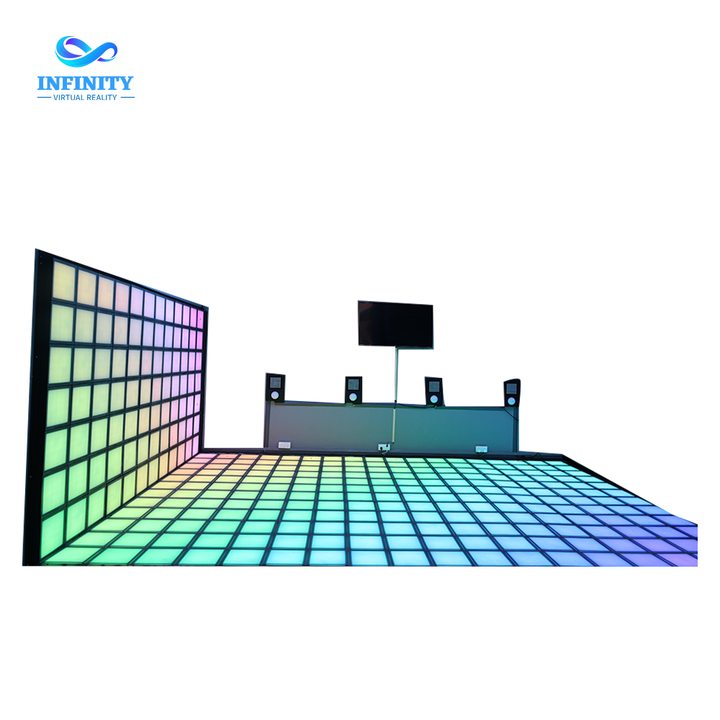
The equipment follows the class. A compact anchor such as our commercial string bowling system carries the compact class's single anchor in a footprint a 10-pin installation would not fit; a flagship anchor like the free roaming VR arena 2.0 anchors a destination zone; and a high-margin interactive layer such as the Infinity Grid LED dance floor is the quick-play density that every size class needs between anchors.
Venues operate from around 500m2 when the mix is chosen for small footprints: one compact social anchor such as string or duckpin bowling, two to four quick-play attractions and a small F&B counter. Below that, a single-attraction model is usually the honest choice.
Equipment alone is commonly planned at $300-$1,000 per square meter (planning reference). Total project cost per square meter - including shell, fit-out, power and first-year operations - lands higher, and grows as a share with size because building systems scale with the envelope.
A 500m2 venue typically carries one anchor plus two to four quick-play attractions. A 5,000m2 destination carries three to five anchors across themed zones plus the quick-play density between them. Anchor count grows slower than floor area because each anchor needs supporting queue and quick-play space to earn.
No. Profitability follows the revenue model clearing the fixed-cost base. A destination venue has a much larger shell, power and staffing base to clear every month; an under-utilized destination floor is the most expensive mistake in the industry. Compact venues reach profitability sooner with less risk.
Yes, and it is the recommended path - provided growth is designed in: electrical service, HVAC and fire zoning reserved for the next class, anchor footprints kept clear, and the circulation loop made extensible. The planning documents are re-run for the new size class at expansion time.
Power, HVAC and fire/life-safety zoning. They are cheap to oversize during construction and among the most expensive things to retrofit. Attraction count is the easiest thing to phase in later; building systems are not.
Tell us your floor area, your audience and your budget. Our team plans the attraction mix, zones and revenue model for your size class - starting with a free 3D layout design of your floor.